Summary: Latitude vs. X
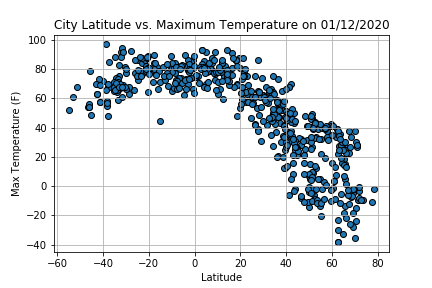
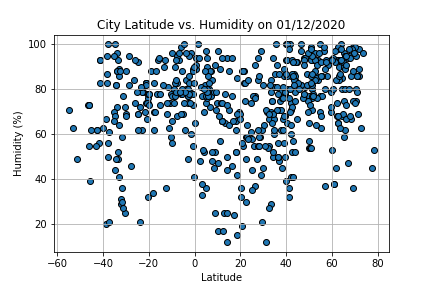
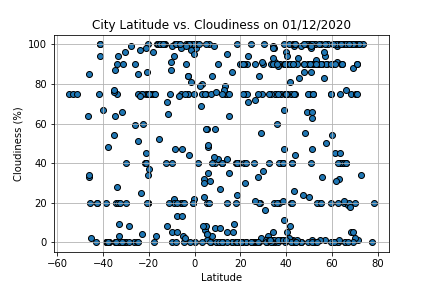
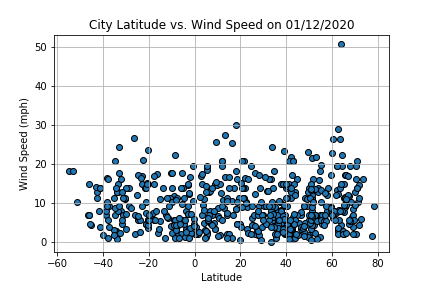
The purpose of this project was to determine how weather changes as you approach the equator (i.e. as latitude increases). To perform this analysis we used the OpenWeatherMap API tp pull weather data from over 500 randomly selected cities.
After collecting the data, we used Matplotlib to plot different weather measurements across latitudes. Factors we looked at included: temperature, cloudiness, wind speed, and humidity. This site provides the data and visualizations created as part of the analysis, as well as explanations and descriptions of any trends and correlations witnessed.
Visualizations